
Classroom Map
What is Classroom Map ?
Classroom mapping is a visual technique used to track how students interact and participate during class. While many peer observation tools focus on the role of the instructor, this method shifts the focus to the students, answering the question: What are the students doing? It works best in smaller classes, such as discussions or labs, where seating arrangements and student engagement with one another and the instructor can be more easily observed. TILT recommends using this as a supplementary tool, providing concrete documentation that can be discussed during the post-observation conversation.
This diagnostic method helps instructors answer key questions about classroom dynamics, including:
-
Are some students more active than others?
-
Why might certain students participate less?
-
Do students primarily engage with the instructor, or is there significant interaction among students?
These questions naturally lead to the central inquiry: How can we create a learning environment where all students actively participate?
Ultimately, classroom mapping offers a deeper understanding of how learning unfolds in the classroom. It allows instructors to look beyond surface-level interactions, gaining valuable insights into student engagement patterns and the overall dynamics of the classroom.
Benefits
Classroom mapping creates a one-page visual snapshot of classroom interactions, which serves as a helpful tool for reflective practice. It prompts critical questions such as:
-
“What patterns do I see?”
-
“Why might these interactions be happening?”
-
“Is this typical of my classroom?”
This method is a powerful tool for analyzing student participation and identifying interaction trends, making it an excellent starting point for collaborative discussions and follow-up consultations.
Limitations
While effective, classroom mapping can be challenging to implement in certain settings (e.g., online). It is particularly difficult to use in classes with frequent group work or in large lecture halls, where tracking individual interactions can become complex. Additionally, it requires practice to master, and the method may only capture visible identities, which could limit the depth of insights. Moreover, engagement may look different across various cultural contexts, and it is often framed by neurotypical standards. Therefore, this tool should be used with awareness and sensitivity to these variations.
Sample Classroom Map
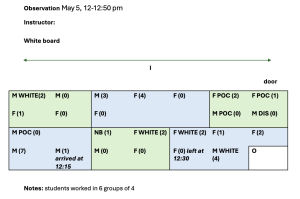
Key:
-
I = Instructor
-
O = Observer
-
M = Male-presenting
-
F = Female-presenting
-
NB = Non-binary-presenting
-
POC = Person of Color (Visibly)
-
White = Visibly White
-
Disability = Visibly disabled (if applicable)
-
( …) = Numbers in parentheses represent frequency of engagement (e.g., number of times the student asked a question or commented).
You can also include additional comments to acknowledge diversity more accurately if it’s relevant to the observation. For example, if you’re noticing how students interact, you might write notes like “Student made two comments and asked questions, noticed engaging mostly with another student of similar background sitting next to them” or “Student made an insightful comment related to the topic.”