
Chapter 4 – Taking Sensor Readings
Humidity
Before we start measuring the humidity and temperature of the air, let’s learn what humidity is.

- Have you ever gone outside after a rainstorm and noticed the air feels wet and sticky? That sticky feeling means there is a lot of humidity in the air around you.
- There are places in the world where humidity in the air is common (think of a coastal town, rainforest, or places near water).
- And there are other places with very little humidity in the air (think of a desert).
- In addition, the humidity will change at different times of the year. For example, winters in temperate climates tend to be drier, while warm summers with lots of rainfall will be more humid.
Humidity and Plants

Air humidity is one variable that can influence the amount of water plants need, so measuring humidity helps gauge the amount of water to give to plants.
Based on what you know so far about humidity, use the Weather app on your cell phone or computer to figure out the humidity and temperature of the locations in these questions.
Detecting Air Humidity and Temperature
Now that you have learned about humidity, let’s take some measurements!
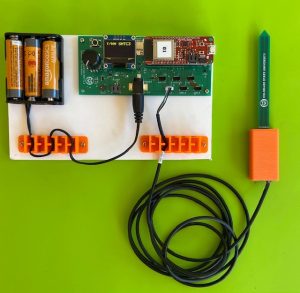
Select each step to learn how to measure the air humidity and temperature using your IoT Sensors. Click on the arrows in the bottom right corner to view activity in full screen.
Comparing Results
Let’s now experiment a little and see what happens when we compare several data readings.
- Put your datalogger side-by-side next to another group’s board in the classroom.
- Set a timer on your phone or computer and wait one minute.
- Compare the results.
- Record your answers in the table on your worksheet.
If you are taking this course independently, take measurements in a different location in the room and compare all of your measurements. Record the measurements in the worksheet provided.
You can also create a table in Excel or MS Word to keep track of your data. It could look something like this:
| Name of Group or Sensor | Air Temperature (C) | Humidity (%) |
| Your sensor | enter data here | enter data here |
| Other group’s sensor (or other location in your room) | enter data here | enter data here |
| Difference | enter data here | enter data here |
Time to Reflect
Select each dialog card to reveal two questions to discuss in your small groups for the next 3 minutes. If you are working independently, take this time to think through these questions on your own.
Data Measurements Can Vary
Sensors never give perfect results. They are accurate within a specified range.
For instance, the humidity sensor in the example below has a specified accuracy of plus or minus (+/-) 3%.
If the actual humidity in the room was 30% for example, one sensor could read 28%, and the other could read 33%, and they would still be working within specification.
Example of Data Collection Task #1: Air Temperature and Humidity Table
| Name of Group or Sensor | Air Temperature (C) | Humidity (%) |
| Your sensor | 20°C | 33% |
| Other group’s sensor (or other location in your room) | 22°C | 36% |
| Difference | 2°C | 3% |
Knowledge Check
Review the material by answering the following question(s).
In the next lesson you will learn how to use the soil sensor.