Appendix: Extra Photos and Notes
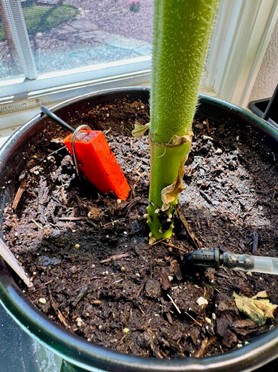
Closeup Photo of soil sensor installation and the emitter.
Notice how the sensor is angled to get a good sample in the center of the root ball. A landscaping “Staple” is then added – point straight down, to hold the sensor in position.
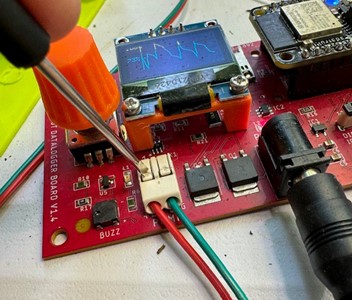
Closeup photo of the water pump connection used on certain kits.
To insert or remove the wires you must press down on the tab on top of the connector using a small screwdriver or blunt pencil.
There are good instructions on how to insert the wire at this link from Adafruit industries.
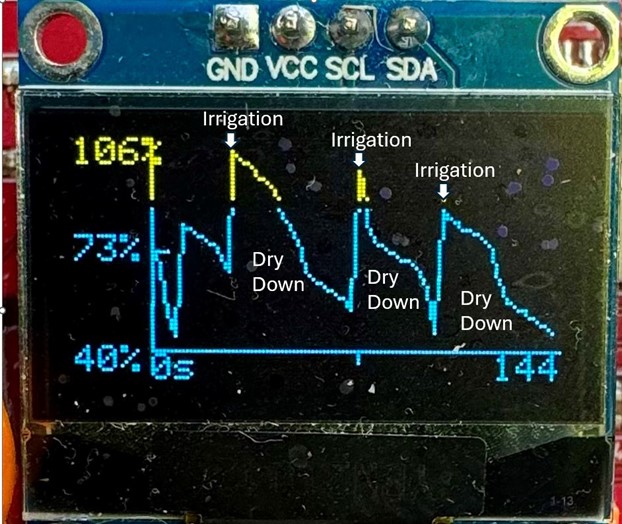
Example plot of Percent Field Capacity vs. time as viewed using menu option 12.
The x-axis on this plot represents 6-days (note, the x-axis is mislabeled). Data are for a large sunflower growing in a 1- gallon pot. In this case we are getting 3 or 4 irrigations every six days, or about once every 1.5 days.